Mesh Research Group
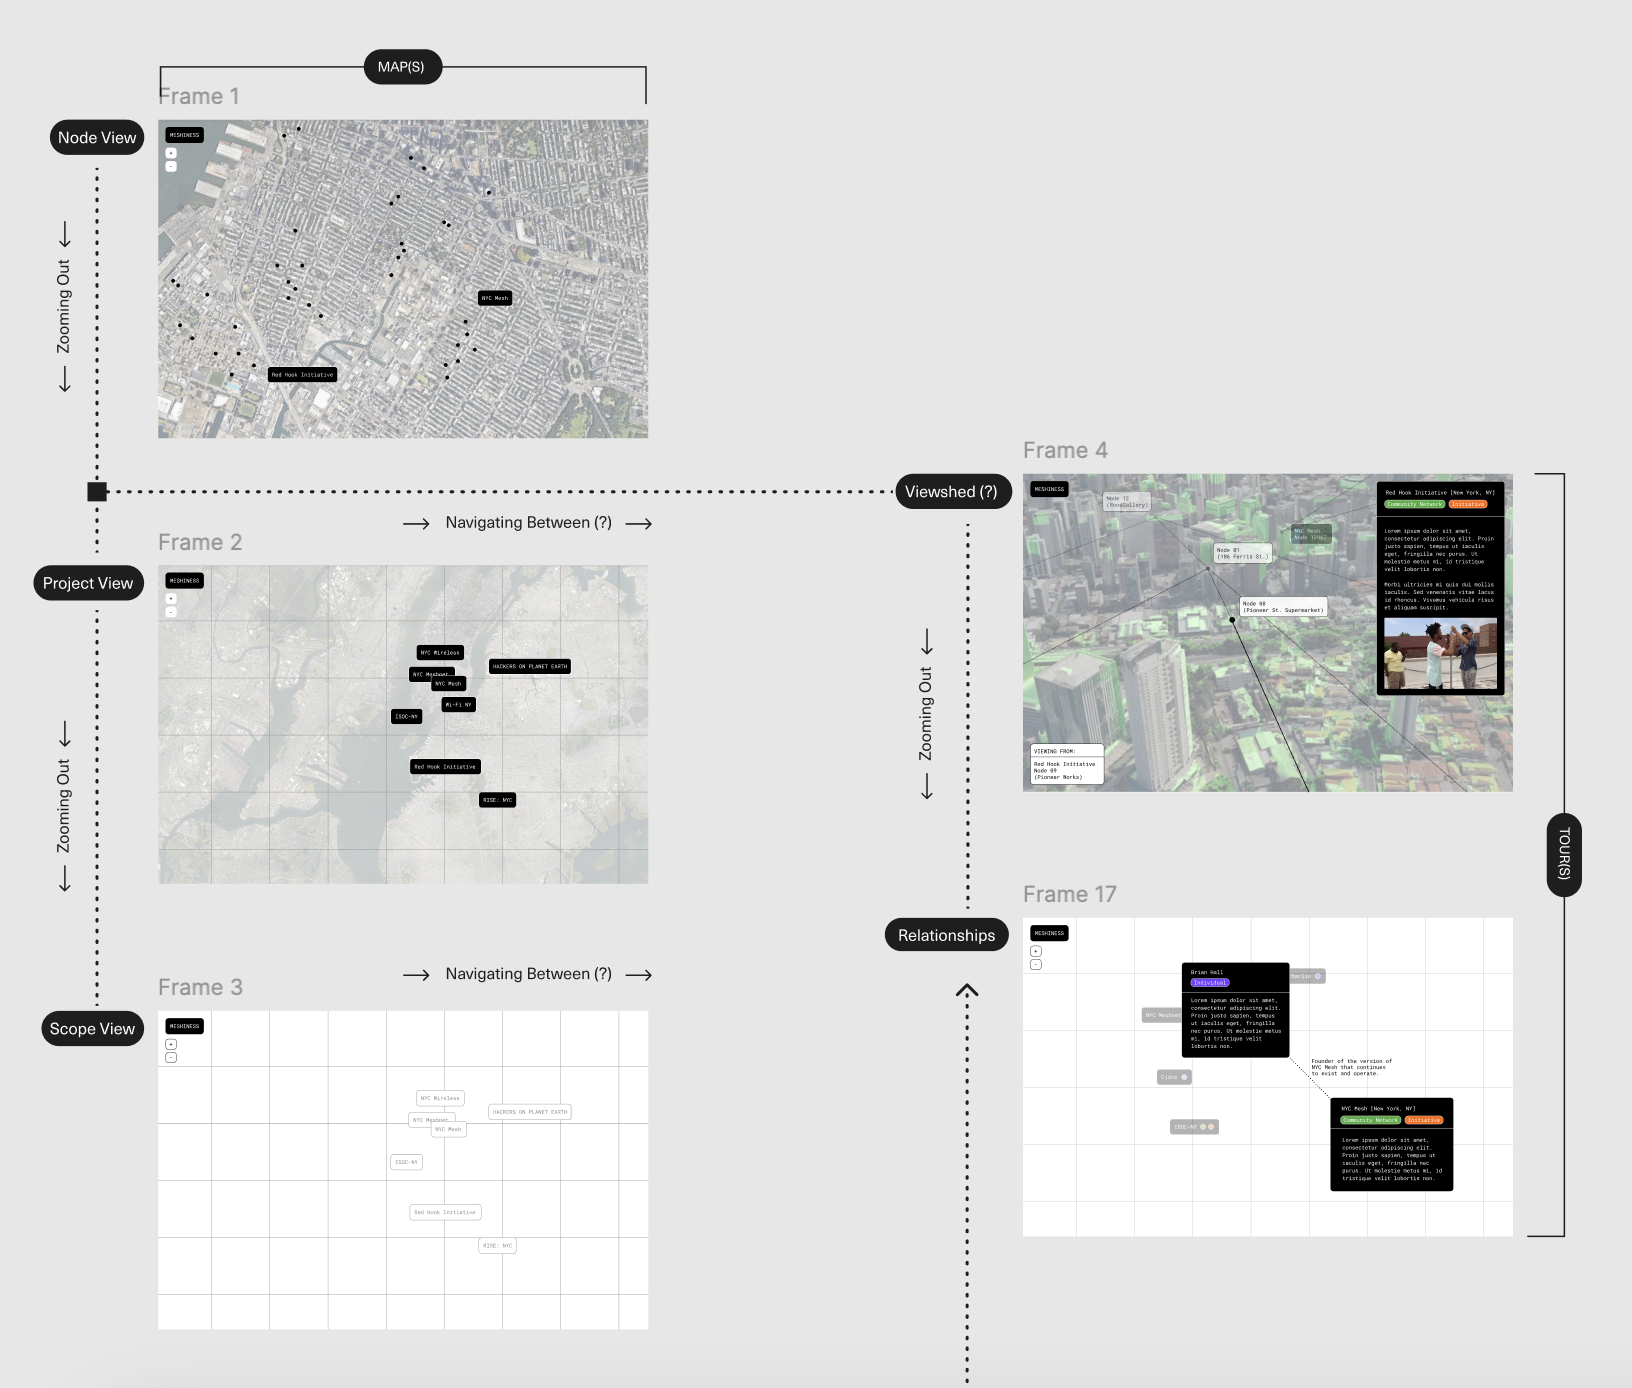
Collection of screenshots from the prototype of the interactive interface that will offer a visualization of select entries from the database, presently in development. The goal with this application is to allow the user to view "lines-of-sight" that cut across this database: conceptual framings that cause certain cases, sites, technologies, and people to coherently align along some conceptual dimension. The interface will be divided into two paradigmatic view: topological, consisting of a top-down traditional network diagram, and topographical, which will offer a line-of-sight view through some particular terrain. Users will be able to zoom in and out of each view, as well as navigating between views, and selecting specific nodes.
 Fig. 1. An overview showing 5 screenshots with arrows
indicating navigation. Users can zoom in our out of each
view, and can navigate between views. (Click to
enlarge.)
 Fig. 2. A top-down, topological view showing the NYC Mesh
project in relation to other nearby networks. (Click to
enlarge.)
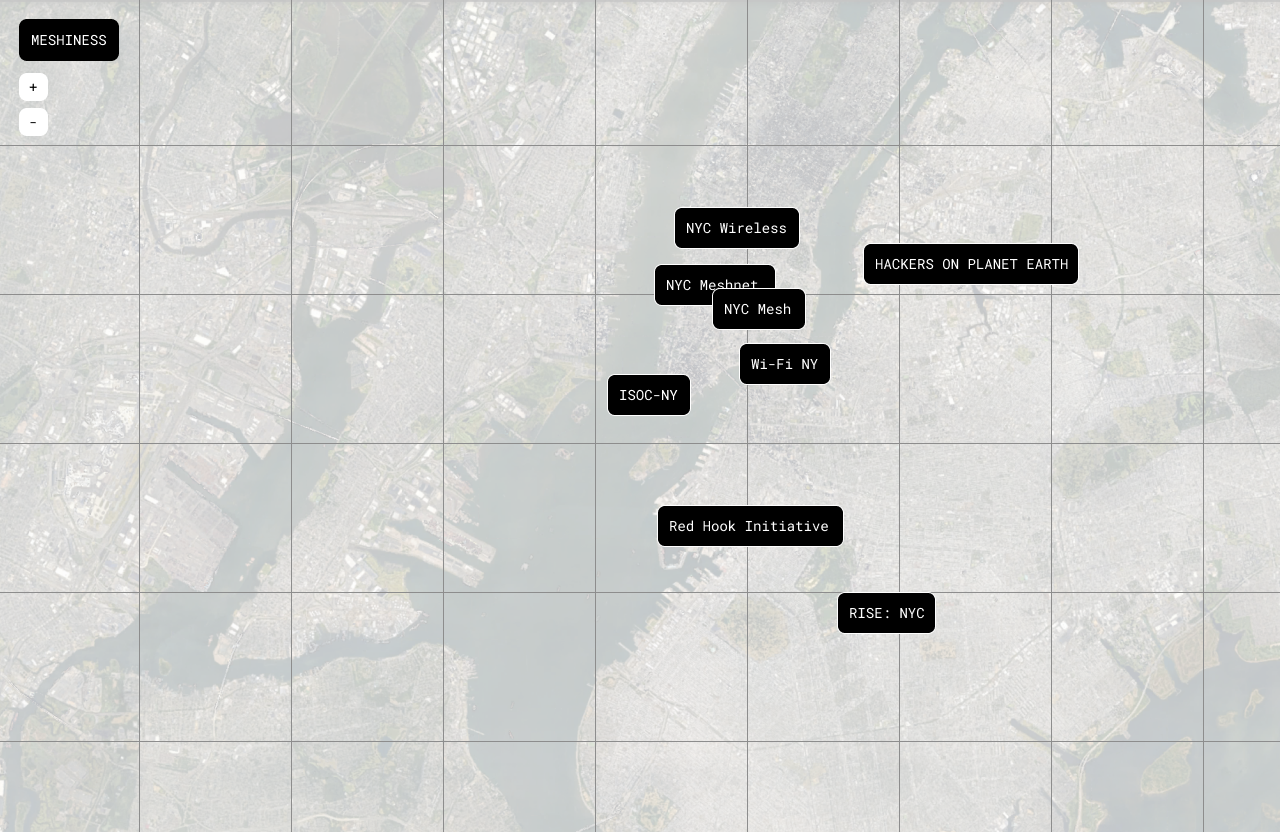
 Fig. 3. Zooming out, the user sees an expanded horizon with more
related projects visible. (Click to enlarge.)
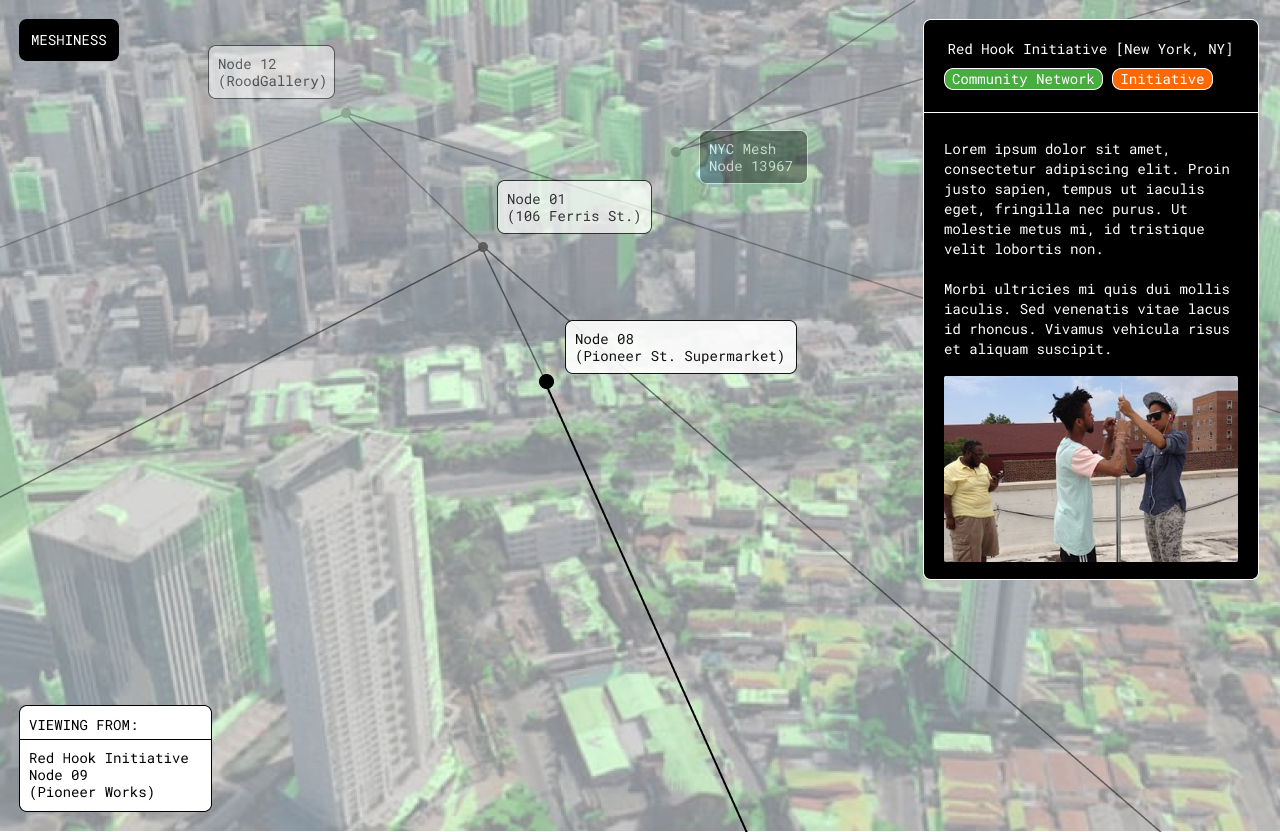
 Fig. 4. Here we see that the user has clicked over to a
topographical view, with lines-of-sight connecting different
elements. Note that these connections are not just physical
network links as one might see in a network diagram, but rather
conceptual linkages that illustrate relationships between
people, protocols, hardward, and software. Note that the green
areas are the viewshed, all the areas visible
from one point, in this case NYC Mesh node 13967. (Click to
enlarge.)
